Stack List
/stack/list admin devops
This is where you manage installed stacks. The list is on the left and the detail panel is on the right.
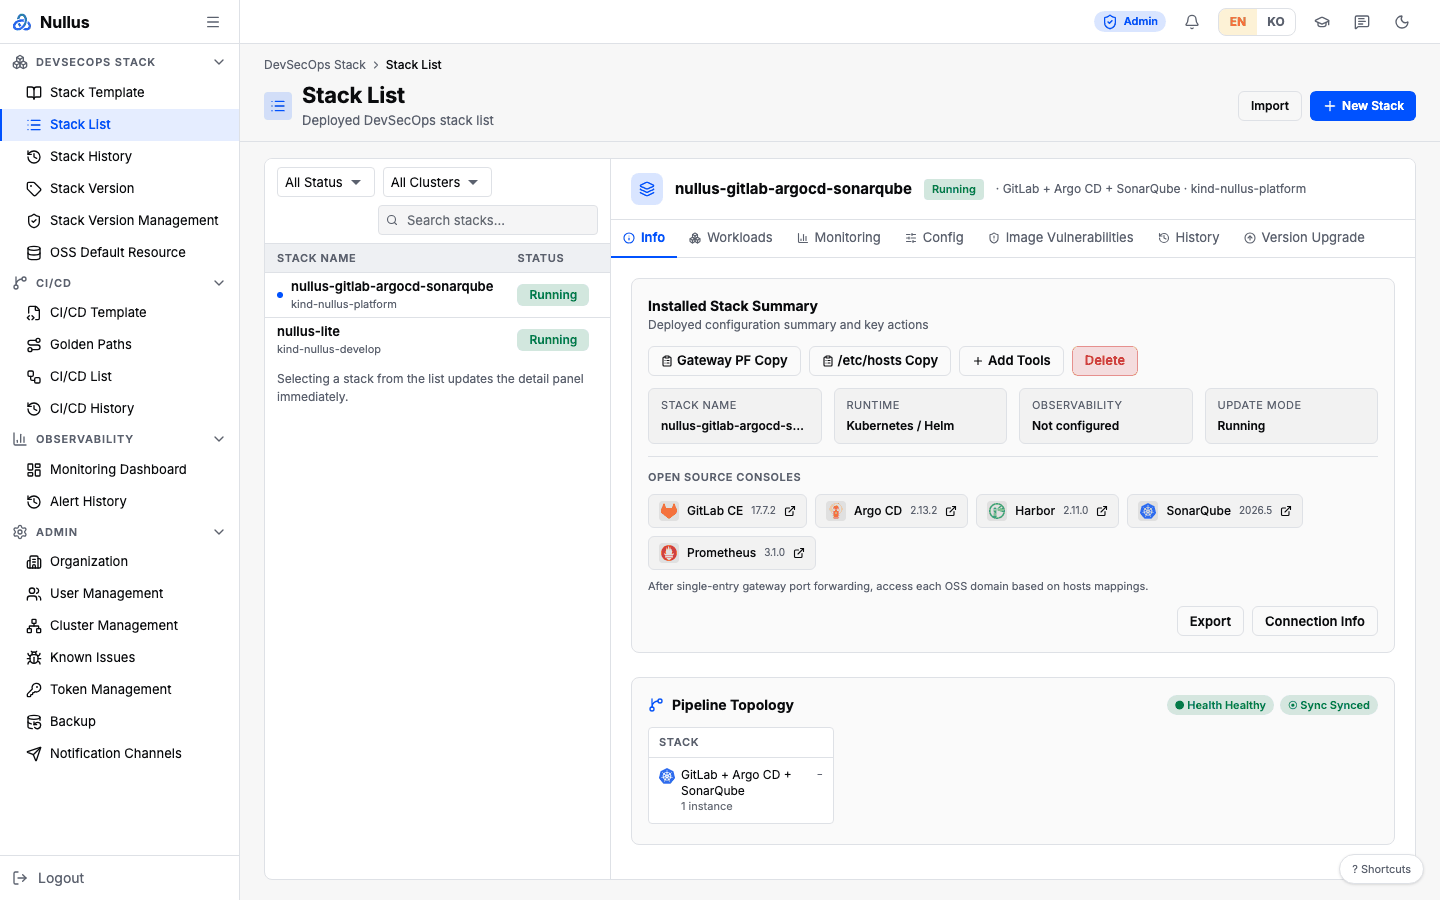
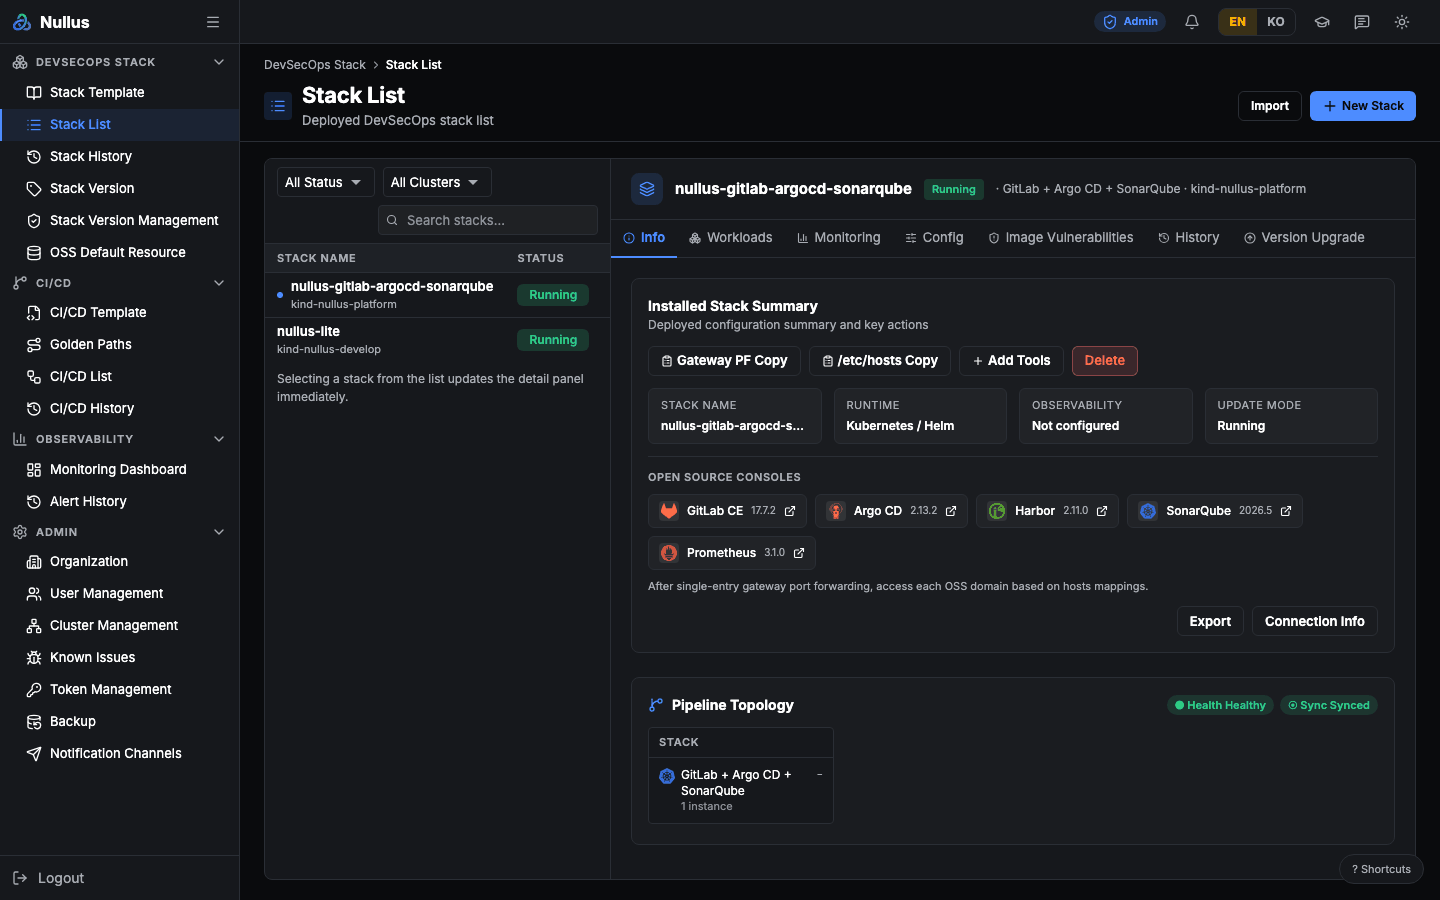
Table and filters
The table columns are Stack Name (with the cluster name on the line below), Status, and Created At. Cluster is not a separate column.
The toolbar has a status selector (All Status · Running · Completed ·
Terminating · Pending · Failed · Cancelled), a cluster selector, and
Search stacks....
Search, filtering, and sorting all happen in the browser
GET /api/v1/stacks ignores every query parameter. The frontend sends
status, search, and include_deleted, but the server reads only the
organization ID. The response is shaped {items, total}. With many stacks,
the screen can get slow.
The buttons at the top are Import and New Stack. New Stack takes you
to Stack Template, not the install screen. The n keyboard
shortcut goes straight to /stack/install.
Detail panel tabs
| Tab | Contents |
|---|---|
| Info | Copy the Gateway port-forward command, copy the /etc/hosts mappings, Add Tools, Retry, Delete, Export, Connection Info |
| Workloads | Pod and workload status in the namespace |
| Monitoring | Appears only when the stack is healthy |
| Config | Pick a release and edit its values in a Monaco editor → Preview changes → Apply → Reset |
| Image Vulnerabilities | Scan results and vulnerability lists for the images the stack installed. Images reachable from outside the cluster (gateway HTTPRoute, LoadBalancer · NodePort Service) carry an Exposed badge (hover for the hosts). The cluster-wide components the stack uses (cert-manager · metrics-server · External Secrets) are scanned too and carry a Shared badge — even when the stack reused one that was already in the cluster, because the stack depends on it. Air-gapped installs are scanned too — images come from the internal registry and the vulnerability DB is the one imported with the bundle, so a note says that CVEs published after the import appear only after the next import. Newly found "fixable CRITICAL" vulnerabilities also go out as the notification stack_cve_found. For grades and response deadlines, see Installed OSS CVE Response |
| History | Buttons that open the install log, change history, and retry history |
| Version Upgrade | See below |
Version upgrades cover Argo CD only for now
The tab lists only the Argo CD release actually installed in the cluster, and only
paths (source chart → target chart) registered as verified after a rehearsal on a
real cluster. With no such path it says No verified upgrade path — that does not
mean you are on the latest version. Paths are not shipped in the migrations; an admin
registers only the ones they have rehearsed, on the Upgrade Bundles tab of
Stack Version Management.
Below the tab, Run history lists the upgrades attempted on this stack (when · path ·
status · requested by · reason), including attempts blocked by preflight
(GET /api/v1/stacks/{stackId}/upgrade-runs).
Click Upgrade to open a dialog with the Preflight checks (Stack state · Other upgrades · Helm release · Version path · a backup from the last 24 hours · Helm dry-run), enter a reason, and click Start upgrade. The upgrade runs in the background on the server and continues even if you leave the page. If it fails, it rolls back to the previous revision automatically; if that also fails, the run is left as Manual intervention required.
If the bundle lists the CVEs the upgrade fixes and some of them are in this stack's current Image Vulnerabilities scan, the row shows Fixes N CVE(s) found in this stack and the dialog lists those CVEs under CVEs this upgrade fixes in this stack. If the scan has none of the CVEs it fixes, the row says so; if that release of this stack has not been scanned yet (no scanner, for example), the row shows only how many CVEs the upgrade fixes.
Add Tools
/stack/:id/add-tools
You get here from Add Tools in the detail panel. This one really is 3 steps, and the step names are numbered.
- Category Selection — Artifacts · Pipeline · Observability · Logging.
Categories that are already installed are disabled and carry an
Installedbadge - Tool Configuration — pick a tool and version for each chosen category
- Review & Save — check the table, then click Confirm & Save
When you save, a "Tool configuration saved (deployment must be run
separately)." toast appears and you return to the list. It only saves the
configuration; it does not deploy
(PATCH /api/v1/stacks/{stackId}/tools).
Retry history
/stack/deployments/:deploymentId/retry-history
Shows past retries with When · Verdict · Issues columns
(GET /api/v1/stacks/{id}/retry-history). It filters the audit log down to
retry actions only, and returns an empty list if there are none.
Export and import
- Export —
GET /api/v1/stacks/{id}/export; you choose the file name and format - Import — after you pick a file,
POST /api/v1/stacks/import/previewshows the differences; when you confirm,POST /api/v1/stacks/importapplies them
Import can overwrite an existing stack
There is a replace_existing option. Always review what changes in the
preview.
APIs it calls
GET /api/v1/stacks · DELETE /api/v1/stacks/{stackId} ·
GET …/{stackId}/history · /monitoring · /workloads · /connection-info ·
/image-scans · /image-scans/vulnerabilities · /releases ·
/releases/{name}/values (GET · PUT) · /values/preview ·
POST …/{id}/retry · GET …/{id}/export · POST /api/v1/stacks/import[/preview]