Monitoring Dashboard
/observability/monitoring admin devops developer
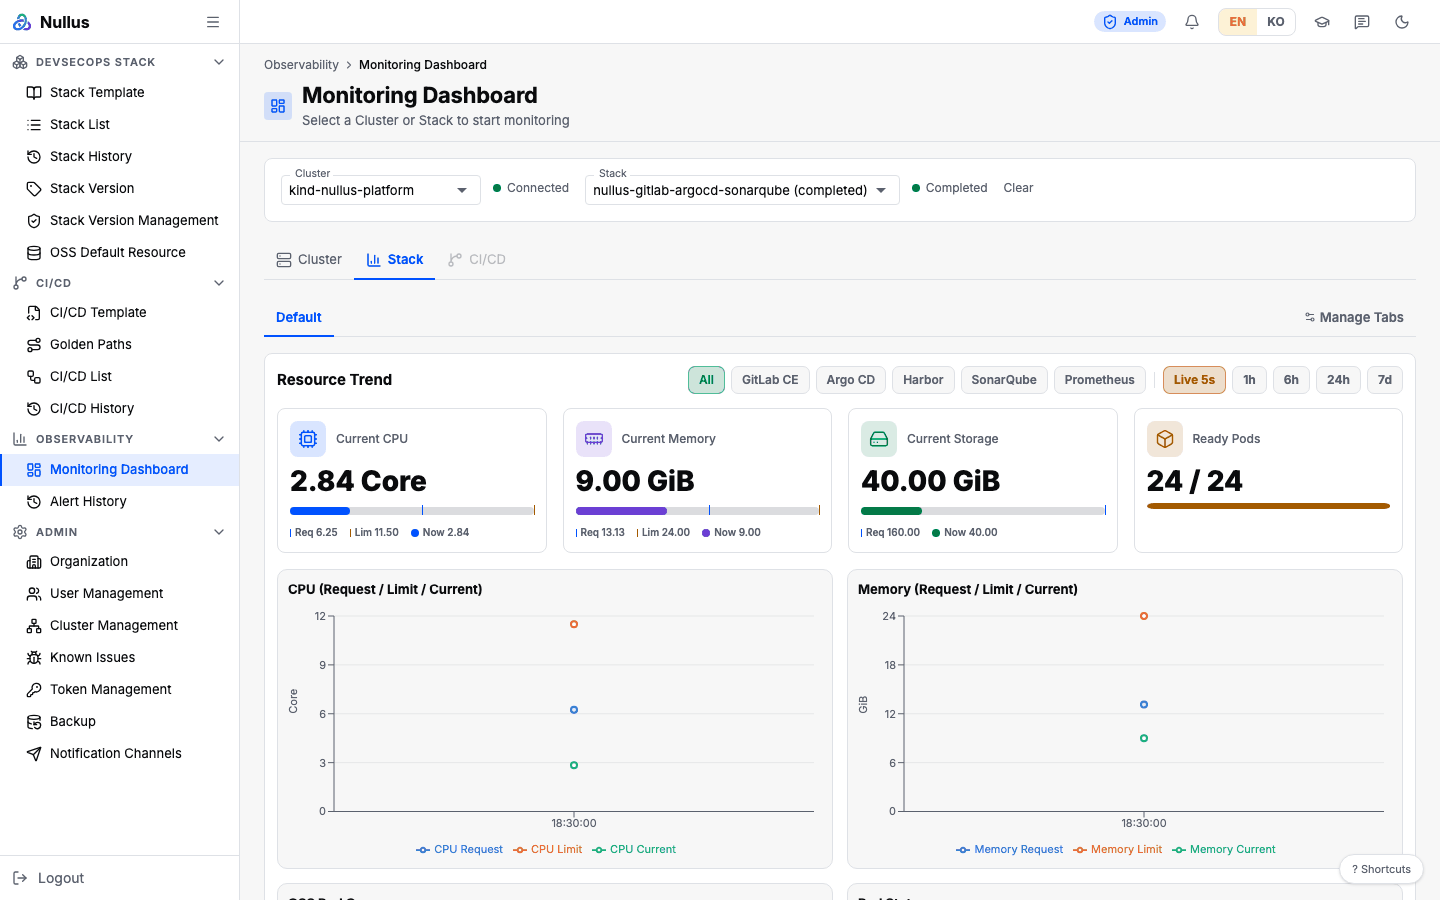
See the state of clusters, stacks, and apps on one screen. Pick a cluster or stack first, and the matching tabs open.
How to use it
- Pick what to view from the Cluster or Stack dropdown at the top of the screen. If you pick nothing, you see only "Select a Cluster or Stack above to begin".
- Pick a view from the tabs below.
- Metrics refresh every 5 seconds. The range pills (
1h·6h·24h·7d) change the chart window.
The three tabs
| Tab | Opens when | Shows |
|---|---|---|
| Cluster | You pick a cluster | Pods, CPU, and memory across the whole cluster; pipeline success/failure |
| Stack | You pick a stack | Resource usage per tool in that stack, and tool health |
| CI/CD | Only when the selected cluster actually has pipelines | Pipeline and deployment totals; live resources and logs of app pods |
Cluster tab
- KPI cards —
Running Pods,Pods,CPU,Memory - Charts —
CPU Usage(area),Memory Usage(area),Pod Status(pie),Pipeline Success (this week)(bar) - Click the
Pod Statuspie to open a pod list modal. Its columns are Namespace · Pod · Status · Ready · Node · Tool.
Stack tab
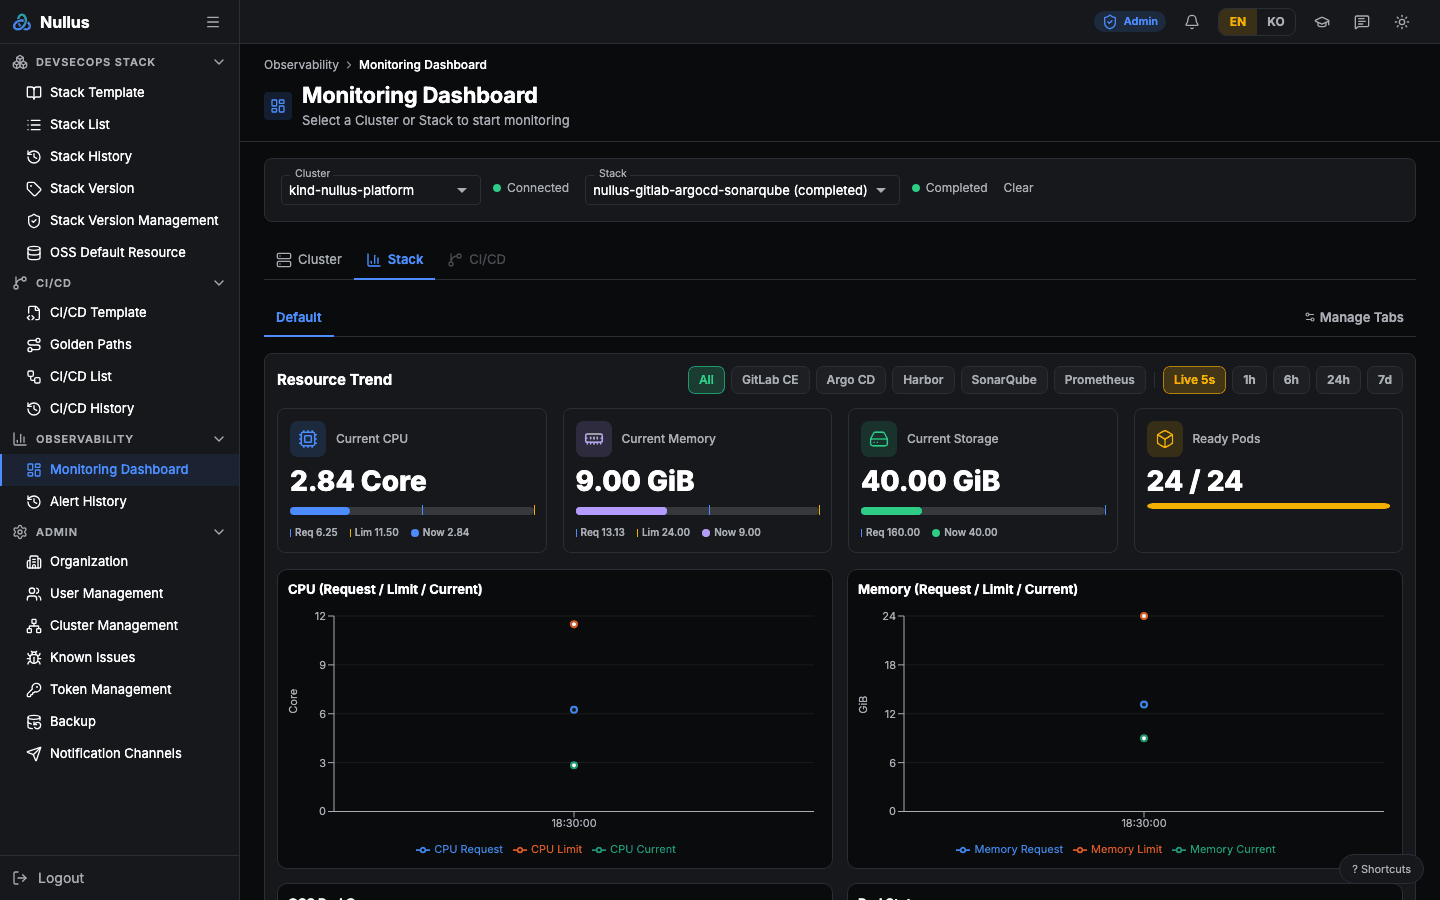
- Resource Trend card — scope pills (
Allplus one per installed OSS), range pills (Live 5s·1h·6h·24h·7d) - KPI cards —
Current CPU,Current Memory,Current Storage,Ready Pods - Charts —
CPU (Request / Limit / Current),Memory (Request / Limit / Current),OSS Pod Coverage,Pod Status(donut) - Tool Health card — a table of installed resources (Kind · Resource · Ready/Desired · Status) and a per-tool pod detail table (Pod · Status · Ready · CPU Req/Limit · Mem Req/Limit · Restarts)
- On their first visit, admins see the Connect Stack Components panel, where they can add the URLs of installed tools as embedded tabs.
CI/CD tab
- KPI cards —
Total Pipelines,Pipeline Success / Failed,Total Deployments,Running Deployments App CPU (Live)·App Memory (Live)charts and an app log panelDeployment Timeline(success/failure bars)
Embedded tabs (Manage Tabs)
Admins can add, reorder, and delete iframe tabs with Manage Tabs. Use it to put an
external screen, such as a Grafana dashboard, in this spot. Non-admins see a View only
badge.
Tab settings stay in that browser only
The screen says "Changes apply to all users after saving", but the settings are stored in localStorage — they never reach other people or other devices, and clearing browser data deletes them.
The embed that ships in the CI/CD tab by default is a public demo dashboard on
play.grafana.org. It is not your organization's data; replace it with your own
Grafana address in Manage Tabs.
Where the metrics come from — not Prometheus
The numbers on this screen are not Prometheus query results. The server collects them by connecting directly to Kubernetes with the cluster kubeconfig.
| Value | Source |
|---|---|
| Pod and workload lists and status | Kubernetes API (client-go) |
| CPU and memory usage | kubectl top pod (metrics-server) |
| Storage usage | kubelet nodes/{node}/proxy/stats/summary |
Trend charts are not retained
Charts such as CPU Usage and Memory Usage are samples the browser collects every
5 seconds. A refresh empties them, and you cannot see yesterday's values — the 7d
range pill does not mean 7 days of data exist. For long-term trends, use the Grafana
installed in your stack.
APIs it calls
| Purpose | Endpoint |
|---|---|
| Cluster list (filter) | GET /api/v1/admin/clusters?page=1&page_size=500 |
| Stack list (filter) | GET /api/v1/stacks |
| Stack snapshot (5-second polling) | GET /api/v1/stacks/{stackId}/monitoring |
| Cluster summary (fallback) | GET /api/v1/admin/clusters/{id}/monitoring-summary |
| Pipelines and deployments | GET /api/v1/cicd/pipelines, GET /api/v1/cicd/deployments |
| App pod usage and logs | GET /api/v1/stacks/{stackId}/workloads, GET /api/v1/stacks/{stackId}/workloads/logs?tailLines= |
The screen opens for developer too, but these APIs do not —
/api/v1/admin/clusters is admin-only, and /api/v1/stacks* is admin and devops only.
So when a developer opens it with authentication enabled, the filters and metrics get
403 and look empty (in development mode with authentication off, they show). The table
that collects these mismatches is in
Permissions.