Alert History
/observability/alert-history admin devops developer
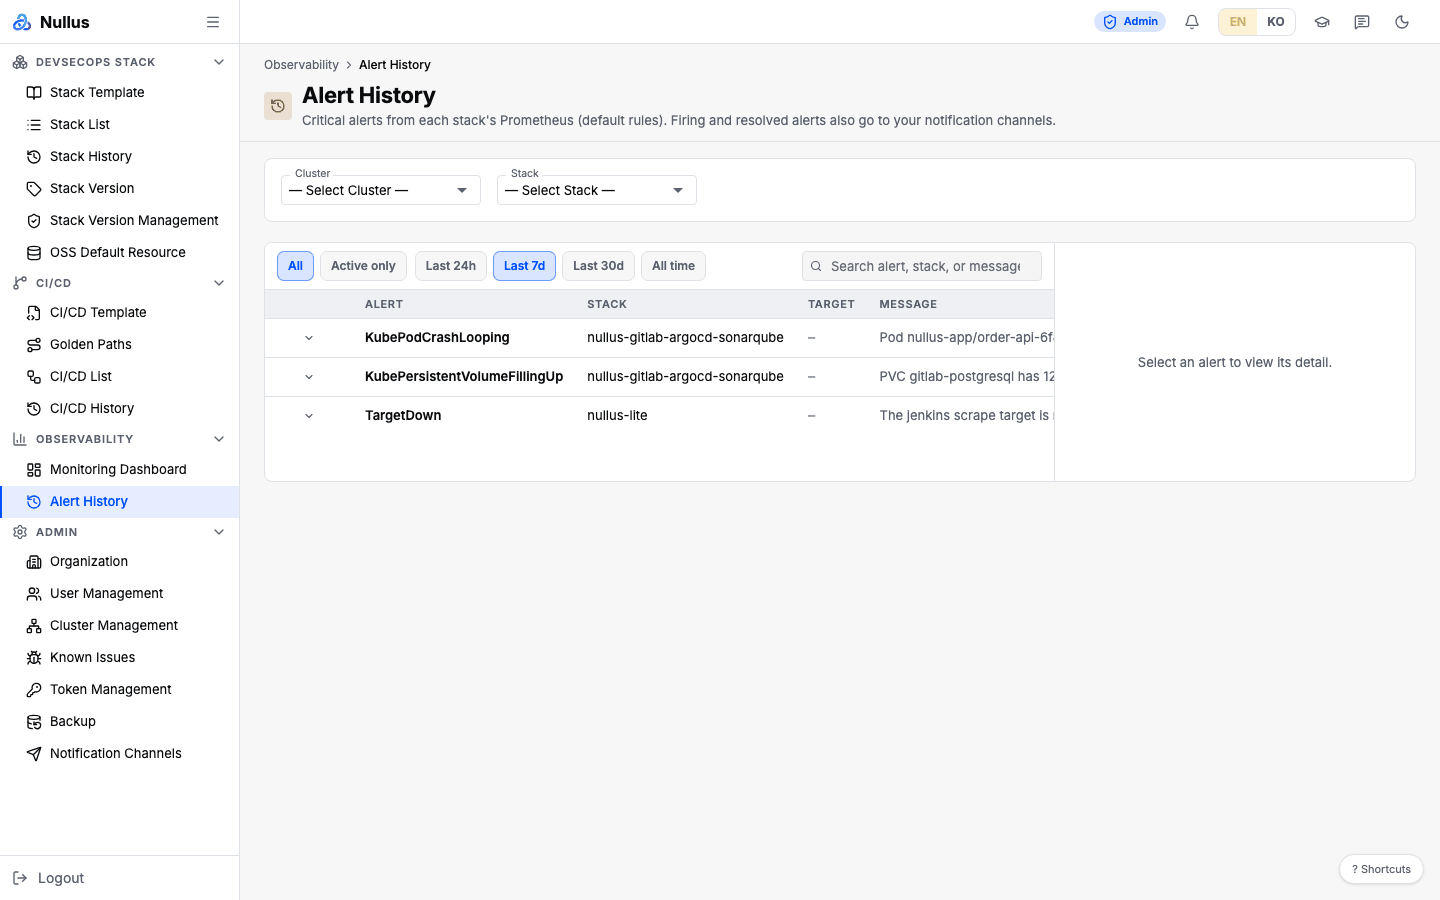
View critical alerts raised by your stacks, in chronological order. As the screen description says, these are the results of each stack's Prometheus evaluating its default rules, and firing and resolved alerts also go to your notification channels.
How to use it
- Narrow by cluster and stack with the filters at the top (optional).
- Switch between
AllandActive onlywith the state pills. This queries the server again. - Pick
Last 24h·Last 7d·Last 30d·All timewith the period pills. The default is 7 days. - Type an alert name, stack name, or summary in the search box to narrow the list.
- Click a row to open the detail panel on the right.
The period and search filter within the list already fetched. The list refreshes automatically every 60 seconds.
Table columns
| Column | Content |
|---|---|
| (expand) | Button that expands the row |
| Alert | Alert name (alertname) |
| Stack | Stack that raised the alert |
| Target | Namespace/pod, PVC, deployment, node, and so on |
| Message | One-line summary |
| Fired At | Time it first fired |
| Resolved At | Time it resolved; an Active badge if it has not resolved yet |
The table has no severity column
The filter already lets through only critical, so severity is not a column. You can
see it in the detail panel.
Detail panel
The panel on the right shows Alert · Stack · Target · Severity · Fired At · Resolved At · Last notified · Message · Description, along with a runbook link and the label list.
Last notified is the last time Nullus sent a notification for this alert to your
notification channels. An alert that keeps firing is re-notified every 4 hours, so this
value can differ from the fired time.
APIs it calls
The response is {items, total}, and each item contains id, stack_id, stack_name,
alertname, severity, summary, description, runbook_url, target,
labels, started_at, resolved_at, last_notified_at, and active. The server's
default limit is 100, and the maximum is 500.
The organization is resolved from the signed-in principal, then the X-Org-ID header,
then the default organization.
Anyone who is authenticated can get the alert list itself (/observability/stack-alerts),
with no role restriction. But the queries that fill the cluster and stack filters are
admin and devops only, so for developer the filters look empty
(permissions table).