Security Dashboard
/observability/security/dashboard admin devops developer
See the security scan results of every stack and every app in your organization on one
screen. It lives under Observability › Security › Security Dashboard in the sidebar, and
/observability/security also brings you here.
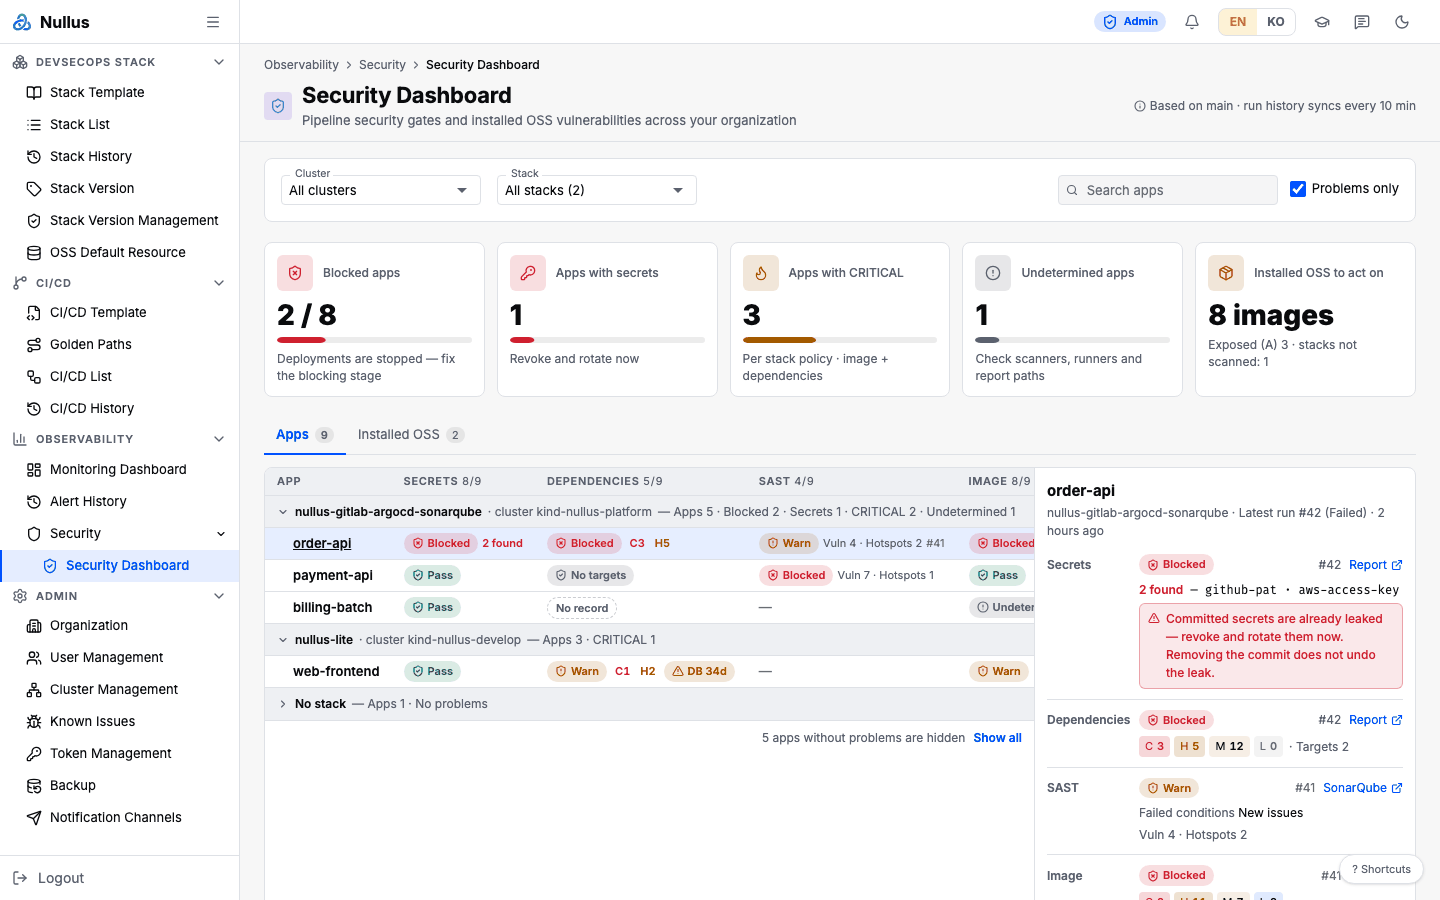
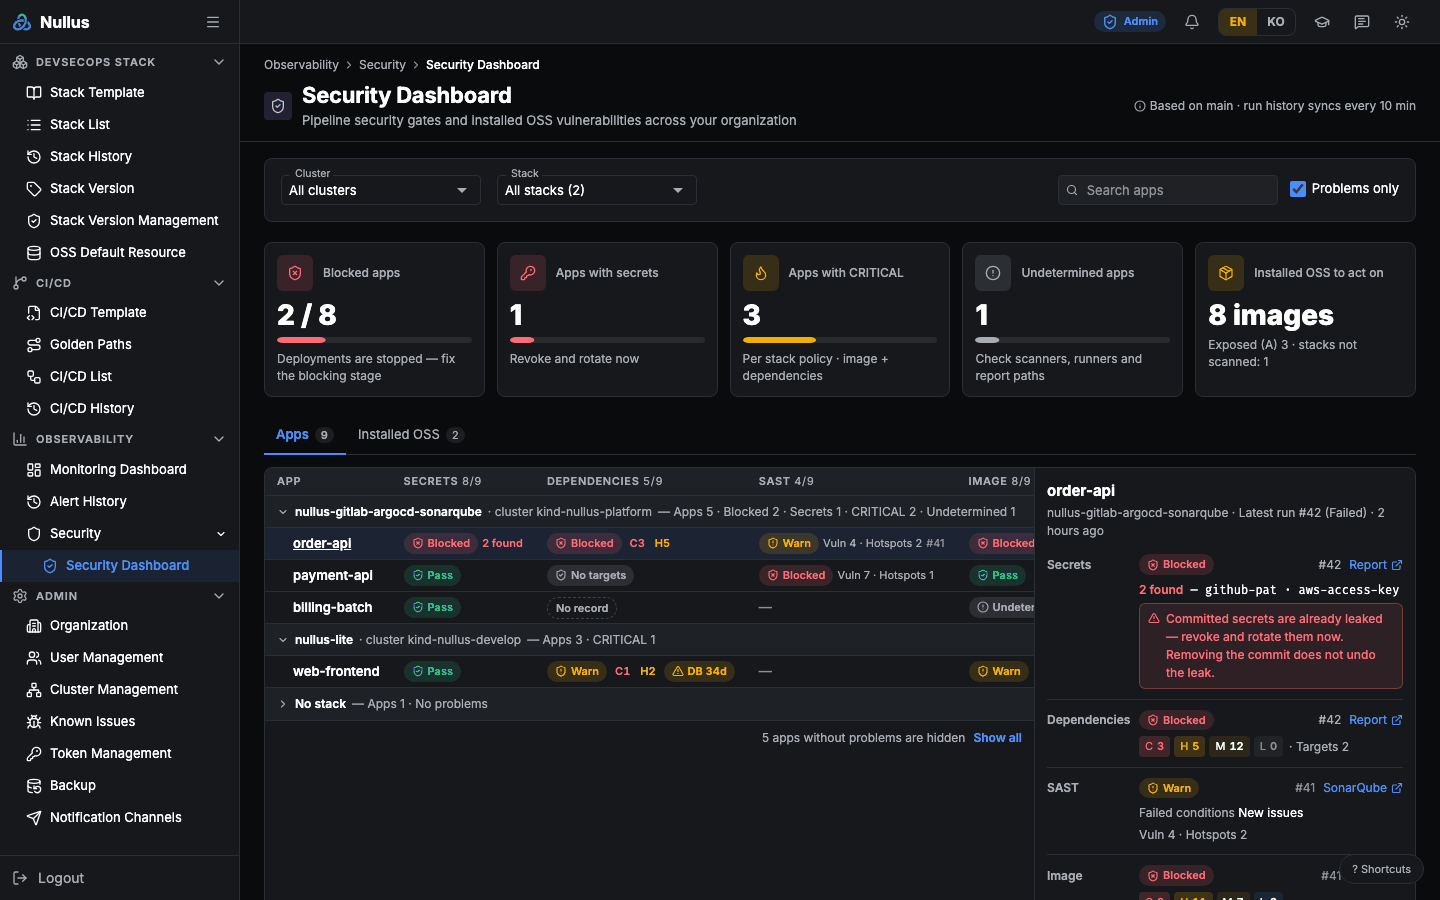
Two tabs — apps and installed OSS
Two kinds of results that behave differently are split into tabs, and their numbers are never added up.
| Tab | What | Nature |
|---|---|---|
| Apps | The four security stages of each pipeline — secrets · dependencies · SAST · image | Gate — blocks deployments |
| Installed OSS | Vulnerabilities in the OSS images your stacks installed, such as GitLab · Harbor · Argo CD | Report — never blocks installs or deployments |
A single installed OSS image often carries dozens of CRITICALs, so adding them up would bury the app numbers. The people who fix them differ too — developers fix apps, while stack operators fix installed OSS by upgrading (Installed OSS CVE Response).
The Installed OSS tab is visible to admin and devops only. Developers see neither the tab nor the fifth KPI card, and the screen does not even call that API for them.
How to use it
- Narrow the scope with Cluster and Stack at the top. The default is
All clusters/All stacks— your whole organization. PickNo stackfor apps without a stack (direct deployments, or apps whose stack was deleted). - Find an app with Search apps.
- Problems only is on by default. Turn it off to also see apps that pass and apps with no
security stage. Show all in
N apps without problems are hiddenunder the table does the same. - Click a row to open the per-stage summary on the right.
The KPI cards follow only the scope filters (cluster · stack · search). Turning Problems only on or off does not change them.
KPI cards
The cards count things to act on, not vulnerabilities. The same base-image CVE would be counted once per app, and image scans and dependency scans overlap on app dependencies. Read the counts in the table cells instead.
| Card | What it counts | What to do |
|---|---|---|
| Blocked apps | Apps with at least one stage Blocked / apps that have any security stage |
Deployments are stopped — fix the blocking stage |
| Apps with secrets | Apps whose secret detection is Blocked or Warn. Counted even under the warn policy |
Revoke and rotate now |
| Apps with CRITICAL | Apps whose image or dependency scan has a CRITICAL (per stack policy) | Update dependencies and base images |
| Undetermined apps | Apps with at least one stage Undetermined or No record |
Check scanners, runners and report paths |
| Installed OSS to act on | Installed images with a fixable CRITICAL (grades A + B), shown with the number exposed (A) and the number of stacks not scanned | Upgrade the OSS |
What \"per stack policy\" means
If the stack's scan policy ignores unfixed vulnerabilities (the default), the counts also include only fixable ones. The numbers on screen must match what the gate saw.
Reading the Apps tab
Each row is one app (pipeline), and the columns follow the pipeline's stage order:
Secrets → Dependencies → SAST → Image. A header such as SAST 4/9 means 4 of 9 apps have
that stage.
With several stacks, apps are grouped by stack, and each group header shows the cluster and the blocked · secrets · CRITICAL · undetermined counts. Groups without problems start collapsed. Pick a single stack and the table becomes flat, without groups.
Cell states
| State | Meaning |
|---|---|
Pass |
Passed the gate |
Warn |
The policy let it through with a warning |
Blocked |
The gate blocked it |
Undetermined |
The scanner failed or its report is missing — this is not a pass |
No record |
The stage exists, but there is no result on main yet |
— (not applied) |
The pipeline has no such stage. For secret detection, also when the stack policy is off |
No targets |
The dependency scan found no lockfile to check and passed — not shown in green |
The numbers in a cell are the finding count for secrets, C3 H5 (CRITICAL · HIGH) for
dependencies and image, and vulnerabilities · hotspots for SAST. When the vulnerability DB is
older than 30 days a DB 34d badge appears.
A cell is the latest result of that stage. When an earlier stage blocks, later stages do not
run, so cells can come from different runs — a cell that is not from the latest run carries a
muted run number such as #41.
Row order
The riskiest apps come first.
- Secrets were found (blocked · warn) — removing the commit does not undo the leak
- A stage is blocked
- Undetermined · No record
- Warn
- Everything passes
- No security stage
Within the same rank: more CRITICALs first, then the most recently run, then by name. Problems only shows ranks 1–4.
Detail panel
Click a row and the right panel shows each stage's verdict, run number, counts, and links to the Report (the CI artifact) and SonarQube. If secrets were found, the revoke-and-rotate warning comes first. No secret value appears anywhere — the report is redacted in CI already.
Details are not rebuilt here. Open run history opens that app's run history tab in CI/CD List directly. The run history now shows dependency and secret detection summaries next to the image scan and SAST.
Installed OSS tab
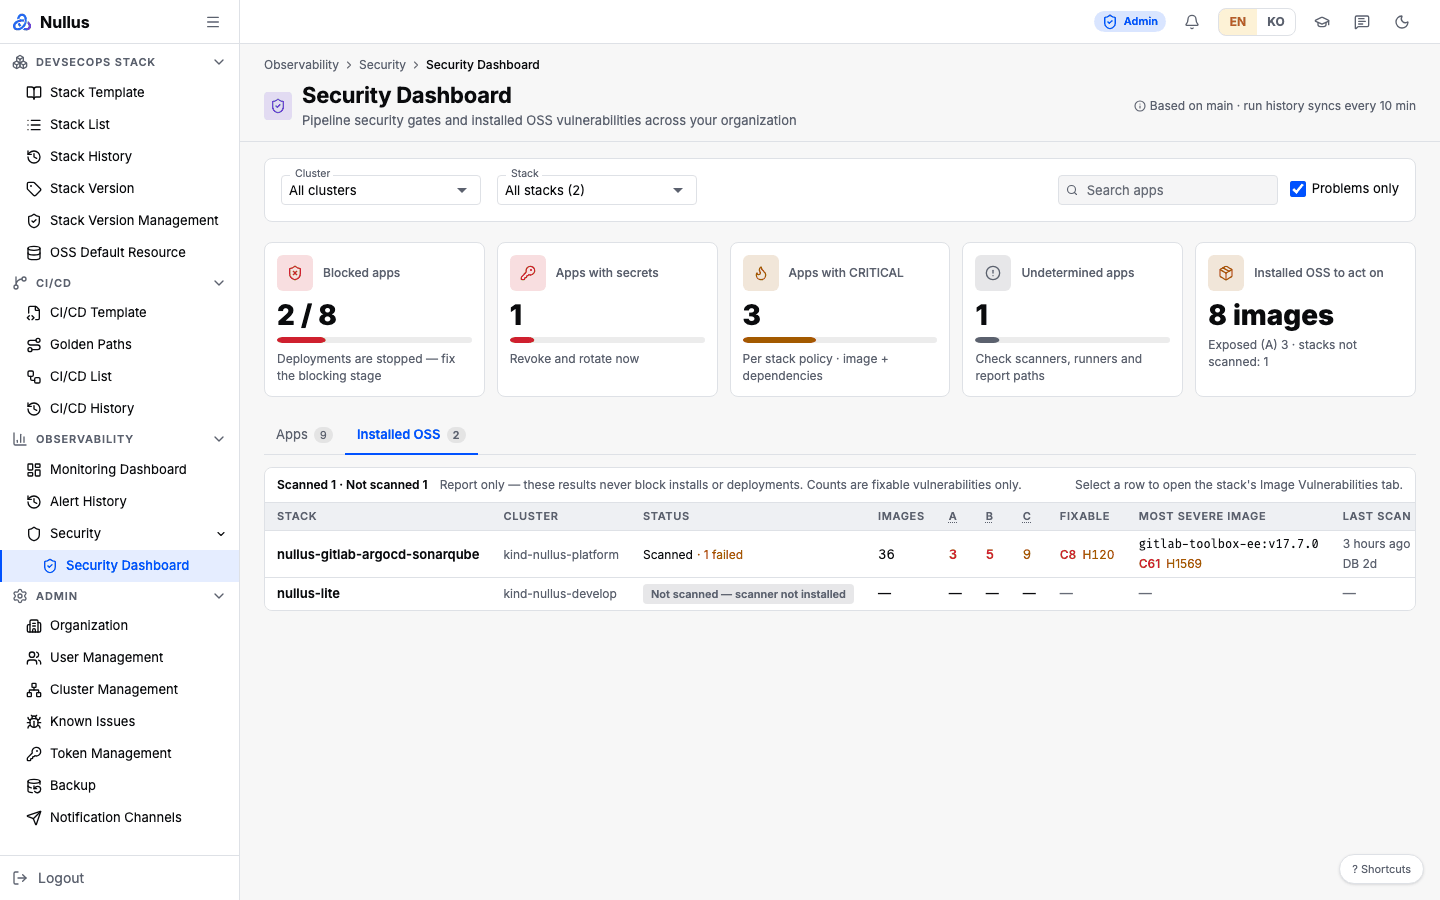
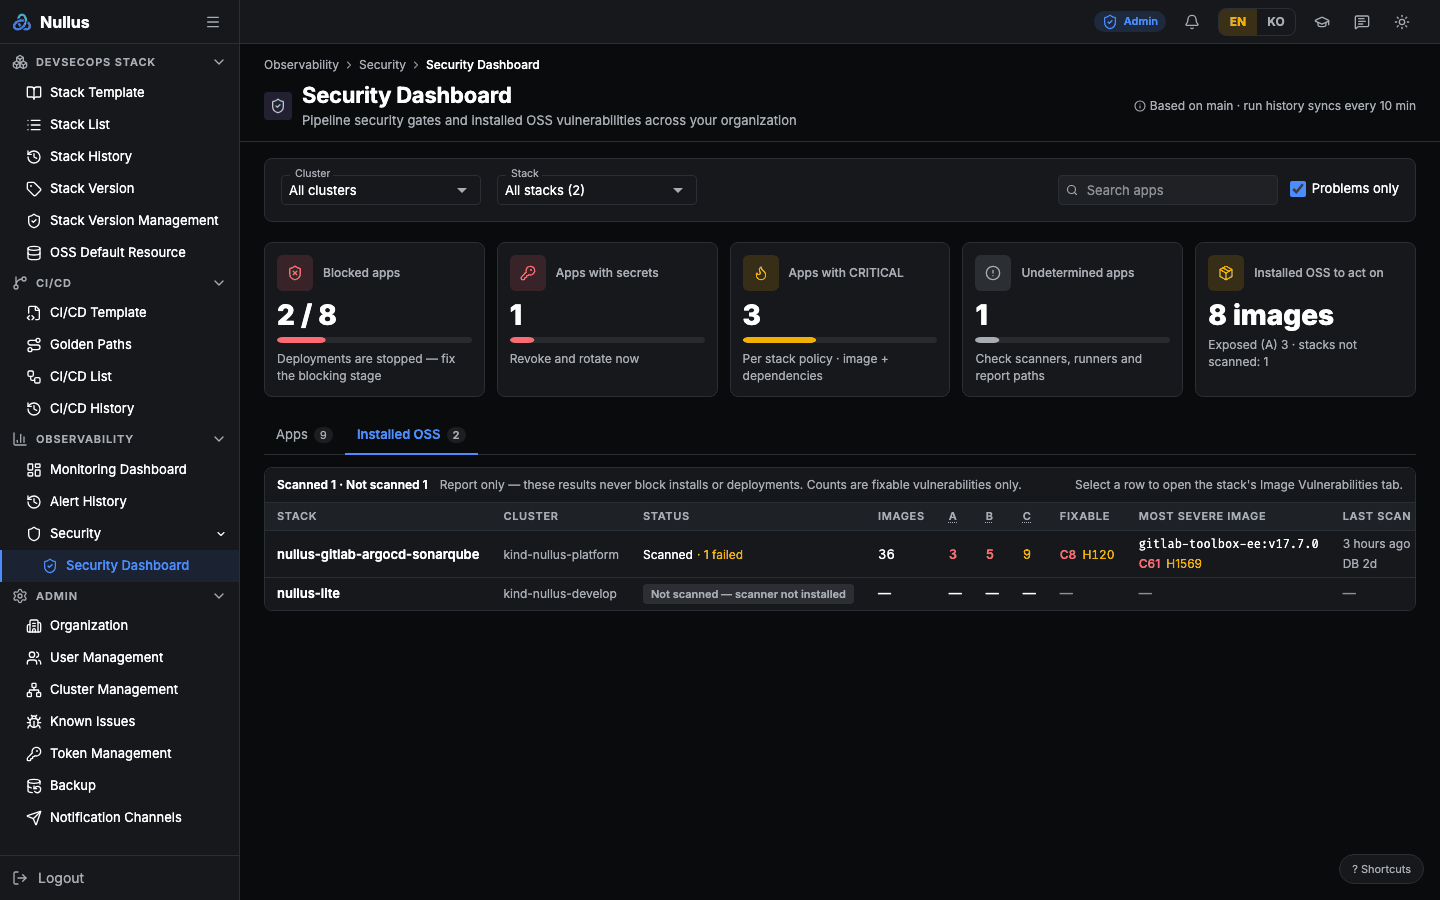
Each stack row shows the number of installed images, image counts by grade, fixable CRITICAL · HIGH, the most severe image, the last scan and the vulnerability DB age. The grades are the grades of Installed OSS CVE Response, counted per image.
| Column | Images counted |
|---|---|
| A | Images with a fixable CRITICAL that are exposed outside the cluster |
| B | Images with a fixable CRITICAL that are internal only |
| C | Images with a fixable HIGH and no fixable CRITICAL |
- Stacks that did not pick a scanner (Trivy) show
Not scanned — scanner not installedand—, not 0. - Air-gapped stacks are marked
Air-gapped, and the DB age is shown by import date. CVEs published after the import appear only after the next bundle import. - Click a row to open that stack's Image Vulnerabilities tab in Stack List.
Where the results come from
| Result | How it arrives | Refresh |
|---|---|---|
| The four app stages | Run-history sync reads the CI artifacts (reports) and records them | Every 10 minutes, and when you open the CI/CD run history |
| Installed OSS | Installed images are scanned against the stack's Trivy server | Right after install, then every 24 hours |
- App results are based on
main. Runs on other branches are not read. - Dependency and secret detection results started being stored with this screen. Earlier runs
show
No record— they fill in from the next run.
APIs it calls
GET /api/v1/observability/security/apps?cluster_id=&stack_id=&q=&problem_only=true
GET /api/v1/observability/security/stacks?cluster_id=&stack_id=        # admin · devops
stack_id=none selects apps without a stack. The organization comes from the signed-in
principal. /security/stacks is the only path in the observability group that checks roles —
developers get 403 (Permissions).