CI/CD List
/cicd/list admin devops developer
The screen for managing the pipelines you have created: a table on the left, a detail panel on the right.
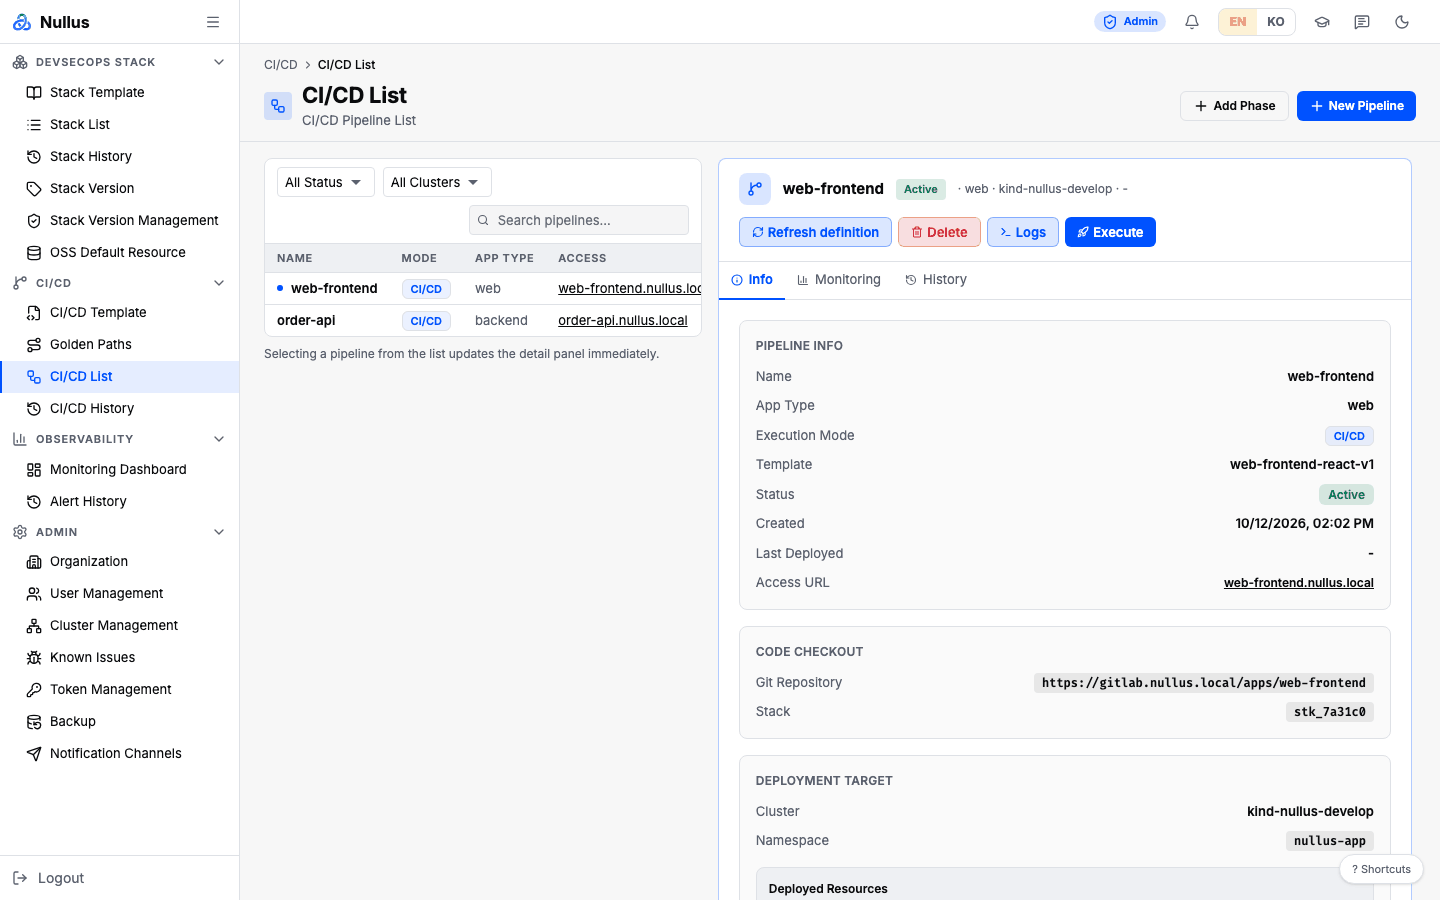
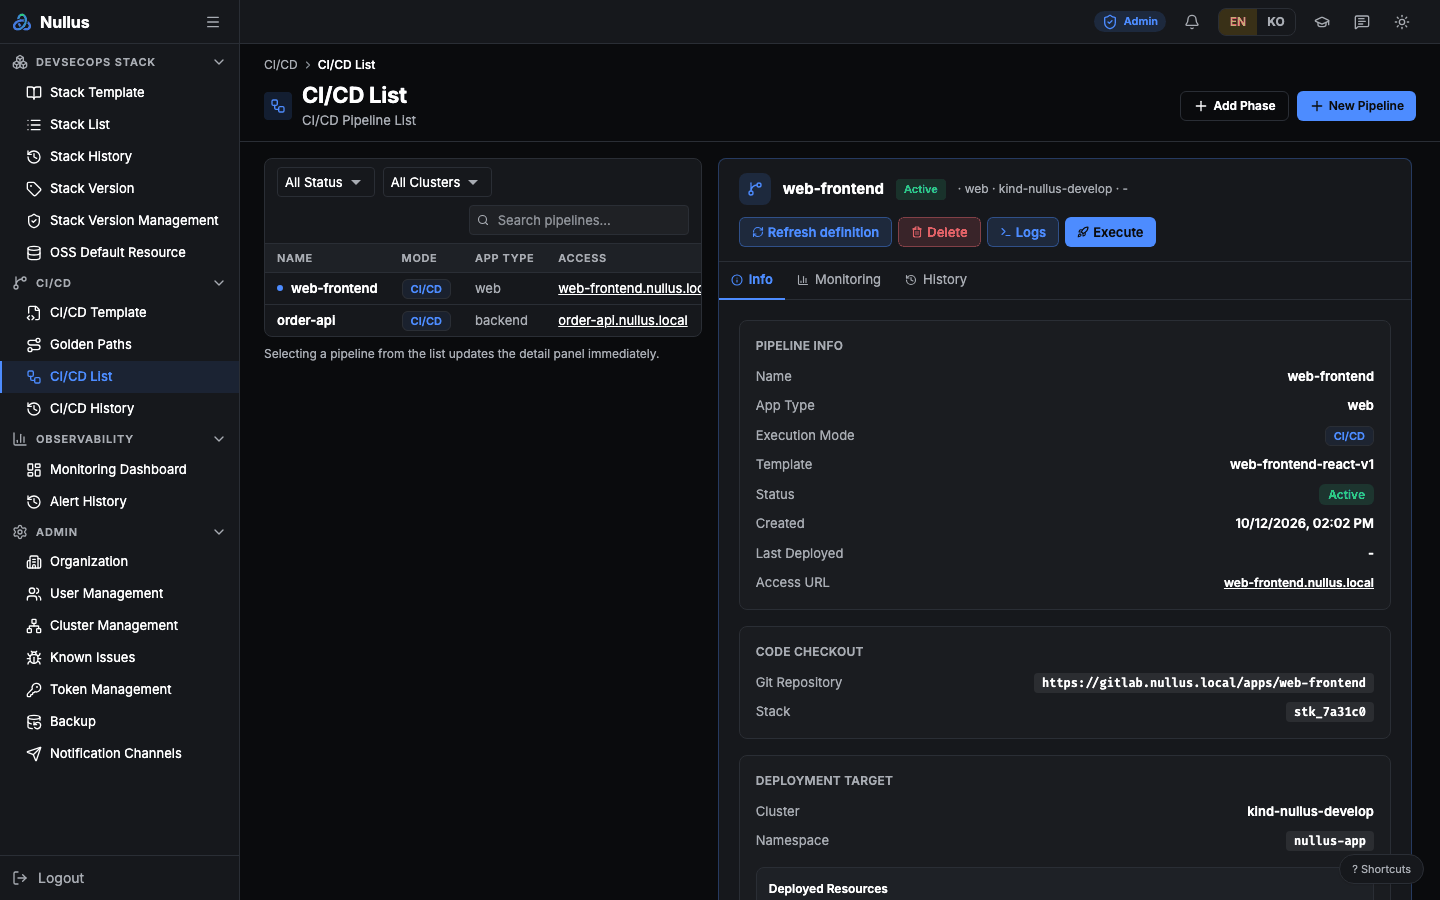
Table
The columns are Name · Mode · App Type · Access (external link) · Cluster ·
Stack (— if none, or Deleted) · Status · Last Deployed.
The toolbar has a status selector, a cluster selector, and search (name and cluster name). The two buttons at the top go to App Deploy and CI/CD Template.
The status filter matches nothing
The options are success · running · pending · failed · cancelled,
but a pipeline's status is only ever active or inactive. So whatever
status you pick, the table goes empty. The filter runs in the browser; the
server ignores status and search.
Detail panel tabs
Info
Service URL link buttons and six card groups.
| Card | Content |
|---|---|
| Pipeline Info | Name · app type · execution mode badge (CI Only/CD Only/CI/CD) · template · status · created · last deployed · access URL |
| Code Checkout | Git repository · stack |
| Build | Dockerfile · build context · image registry |
| Deployment Target | Cluster · namespace, plus the Ingress→Service→Deployment/StatefulSet→Pod resource chain (including Job and CronJob) |
| Environment Variables | Masked; click to reveal |
| Manifest Overrides |
Monitoring
Success rate, average duration, the 7-day success/failure trend, app resource
usage charts, a log panel, and a Live Resources list with a refresh button.
History
One row per deployment — status badge · version · image scan gate badge with severity counts · SAST gate badge · dependency scan gate badge with severity counts · secret detection gate badge with the finding count · triggered by · duration · start time.
Expanding a row shows the deployment ID, scan details (vulnerability list and filters), SAST failed conditions and metrics, dependency scan details, secret detection details (rule · file:line · commit · fingerprint — never the secret value), the Pipeline Stages list, and the Detailed Logs terminal. Runs with detected secrets show the revoke-and-rotate warning first.
Open run history in the Security Dashboard
opens this tab and that run directly via /cicd/list?pipeline=<ID>&tab=history&run=<deployment ID>.
Some CIs do not report stage results
When there is no per-stage data, the list shows
템플릿 정의 · 이 CI 는 단계별 결과를 보고하지 않습니다 (hard-coded in Korean:
"Template definition · this CI does not report per-stage results"), and the
stages stay unknown instead of turning green.
Buttons
| Button | What it does |
|---|---|
| Execute | Runs the pipeline (POST /api/v1/cicd/pipelines/{id}/deploy → 202) |
| Logs | Goes to /cicd/pipelines/{id}/logs |
| Refresh definition | Rewrites the CI definition in the repository. Shown only for pipelines linked to a stack |
| Delete | See below |
Settings in the Execute dialog are not sent
The run dialog has Cluster / Build / Deploy tabs, Dockerfile presets, and a
deploy YAML picker, but none of it reaches the server. The only thing
actually sent is the pipeline ID. The dialog's choices are decoration.
What Refresh definition overwrites
The dialog spells it out — one of .gitlab-ci.yml · .github/workflows/nullus-ci.yml ·
Jenkinsfile, plus CI variables such as SONAR_TOKEN.
It does not touch application code, the Dockerfile, the deploy/ manifests, or
the Argo CD Application.
On GitLab stacks it also re-adds the push webhook that tells Argo CD about new commits, if it is
missing (App deploy).
Delete options
Three checkboxes, all unchecked at the start — cluster resources, source
repository, and container images. If you select the repository, you must type the
exact owner/repo path before the confirm button is enabled. Anything that could
not be deleted is reported in a banner.
Selecting cluster resources deletes the Argo CD Application and the deployed
workloads, plus the two Secrets the platform created along with the pipeline — the
image pull credential in the app namespace (nullus-registry-<app>) and the repository
credential in the Argo CD namespace (nullus-repo-<app>). A Secret without the platform
label (app.kubernetes.io/managed-by=nullus-cicd) is left alone even if the name matches.
The app namespace itself is not deleted.
Gitea and Jenkins stacks keep pipeline credentials separately — an ExternalSecret nullus-ci-<app>
in the stack namespace, the Secret ESO creates from it, and the values under
kv/nullus/<env>/<org>/cicd/pipelines/<app>/ in OpenBao. Only the CI job uses these credentials, so they
are deleted together with the CI job regardless of the checkboxes. The ExternalSecret goes first (the
Secret ESO created goes with it through its owner reference), then the vault values. An ExternalSecret
without the platform label is deleted only when all of its remote keys sit under that pipeline's vault
path. Anything that cannot be deleted does not stop the rest of the deletion; it is reported in the
banner.
Credentials are found by pipeline name. If another pipeline with the same name exists on the same stack,
it uses the same credentials, so they are kept and the banner says why. A name that cannot be a single
segment of the vault path (one containing /, or exactly . or ..) is never deleted either — it would point at
another pipeline's values.
Stacks installed earlier keep the vault values
Deleting vault values needs a delete permission in the vault policy, and that permission (on the pipeline credential path only) is written when the stack is installed. After installation the root token is revoked, so the policy cannot be changed: on stacks installed before this feature the vault values stay and the banner says the stack has no delete permission. The ExternalSecret and the Secret are still deleted.
Pipeline creation screen
/cicd/create
A separate screen lets you enter a Pipeline Name, choose a template, and fill in the
Cluster / Build / Deploy / Pipeline YAML tabs.
There is no way in
Apart from this screen's own template picker, nothing in the app links to
/cicd/create. Use Base Template on CI/CD Template goes to
App Deploy.
On top of that, the three Dockerfile presets on the Build tab and the three
YAML presets on the Deploy tab are read-only fixed values, and the content of
the Pipeline YAML tab is only generated and displayed on screen —
it is not sent. On create, only four values actually go out: name, app
type, cluster, and template.
If the template list is empty, the screen falls back to fake templates named
web-frontend·web-backend·batch-job. Their app type values are ones the
DB does not accept (only web·backend·batch are allowed), so creation is
rejected.
The way to actually create a pipeline is App Deploy.
Pipeline logs
/cicd/pipelines/:id/logs
On the left, a list of recent deployments (version, status, start time, newest
first); on the right, a terminal pane with a block per stage. The screen title is
hard-coded in English as Pipeline Logs.
The Streaming... indicator is not real streaming
The screen re-requests GET /api/v1/cicd/deployments/{id} every 2 seconds
and stops once the status becomes success or failed. The repository has
code for receiving logs over WebSocket, but nothing uses it and there is no
server-side route for it.
APIs it calls
GET /api/v1/cicd/pipelines · /templates · /deployments ·
/deployments/{id} · /pipelines/{id}/resources · /image-scans ·
/image-scans/{scanId}/vulnerabilities · /sast-results ·
POST /pipelines/{id}/deploy · /pipelines/{id}/refresh-definition ·
DELETE /pipelines/{id}?cluster_resources=&repository=&images=
The screen also calls GET /api/v1/admin/clusters (admin only) and
GET /api/v1/stacks (admin and devops) — these return 403 for developer, so the
cluster and stack pickers look empty
(Permissions).